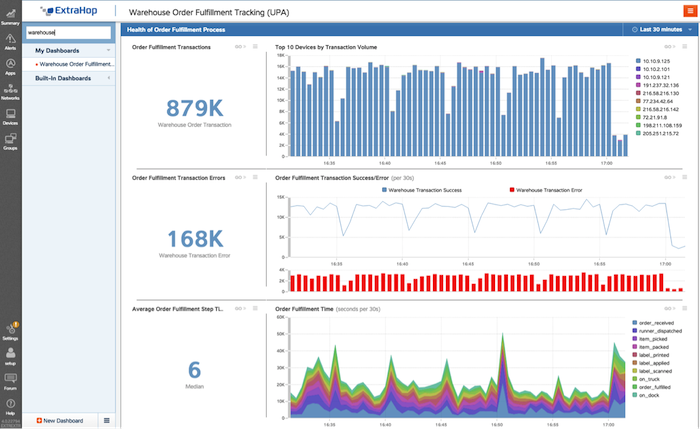
- A custom dashboard built to track order fulfillment in a warehouse. In this post, we will show how to build a custom dashboard like this one.
Using such a methodology and exploring the interface, dashboards are not only easy to create but also fun. It's amazing to watch your data come alive and tell you things that you didn't know before. As always, the ExtraHop platform Web Users guide is the complete reference on dashboards: https://docs.extrahop.com/current/web-ui-users-guide/.
What Are Dashboards?
ExtraHop dashboards are fully customizable HTML pages that display real-time and historic data for any of the thousands of built-in or any custom created metrics in the ExtraHop platform.If you would like to create a dashboard while reading along this post, sign up for our [free, interactive online demo](/demo/) and follow along.
What Does a Dashboard Look Like?
Let's take a look at a dashboard final product. In the dashboard shown below, the user has built a page to track potential exfiltration of personally identifiable information (PII). If there are any indications that someone is attempting to extract data from secure databases, this dashboard will surface that information immediately. In this single dashboard, we have real-time statistics for a number of key indicators as well as a real-time runbook telling operators what to do if they see any of these warning signs.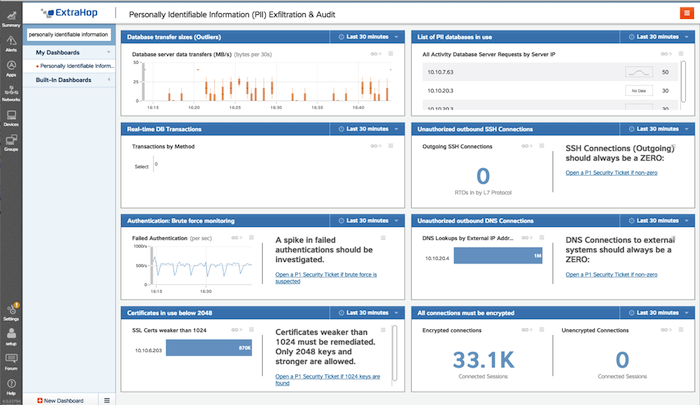
Let's break down the components of this dashboard:
- "Database transfer sizes (outliers)" – This shows the average transfer sizes in the database. Alert condition: A spike in database transfers would be unusual and warrant and investigation.
- "List of PII databases in use" – A list of all of the databases with PII in use.
- "Real-time DB Transactions" – The actual database queries taking place.
- "Unauthorized outbound SSH Connections" – Outgoing SSH connections are prohibited from databases. Alert condition: Any non-zero number.
- "Authentication: Brute force monitoring" – The rate of authentications in the environment. Alert condition: A spike in failed authentications would warrant further investigations.
- "Unauthorized outbound DNS Conenctions" – Show any external DNS lookups. Alert condition: Any non-RFC 1918 DNS servers in this list.
- "Certificates in use below 2048" – All certificates in the environment should be 2k or higher for this environment. Alert condition: Any certificates weaker than 2048 must be investigated immediately.
- "All connections must be encrypted" – Display the traffic for all encrypted and unencrypted connected sessions. Alert condition: If there is any unencrypted traffic, it should be alerted on immediately.
How Did We Build a Dashboard Like This?
For the TME team, we use a four-phase process in dashboard creation. These phases are: design, implementation, usage, and iteration. In working with our users and creating our own dashboards, we have found that first using the dashboards and then tweaking them leads to the best results. The most useful dashboards are the ones that go through multiple iterations over time.Design Phase
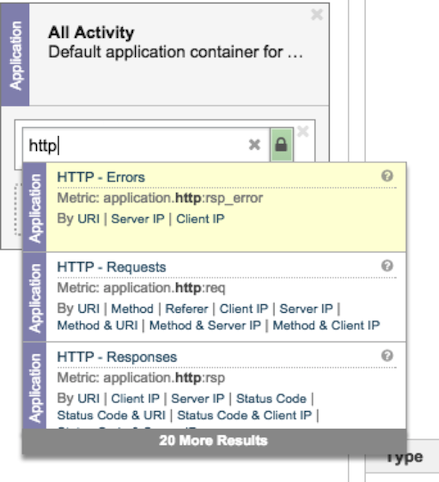
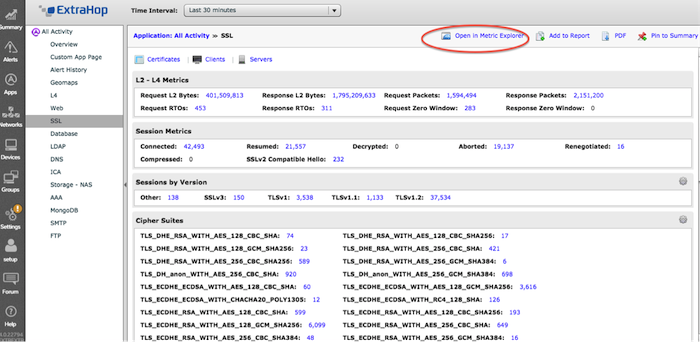
Begin by sketching how you would like the dashboard to look. You can either drag and drop objects in the ExtraHop builder, use layout software, or just sketch on paper. Take note of the metrics that are going to be the most useful to you. You can find metrics in three different ways:- The Metric Explorer
Accessing the Metric Explorer allows you to explore any of the thousands of built-in or custom metrics in the ExtraHop platform.
- Browsing ExtraHop pages and charts
Browsing ExtraHop pages is another good way to find metrics you are interested in and then add them directly to a new or existing dashboard.
- Creating and committing a custom metric
ExtraHop Application Inspection Triggers allow you to create and commit a custom metric in a matter of minutes. These custom metrics can then be used in any dashboard. See this useful post on metric types and the trigger documentation: https://forums.extrahop.com/t/tip-of-the-week-metric-types/291
Implementation Phase
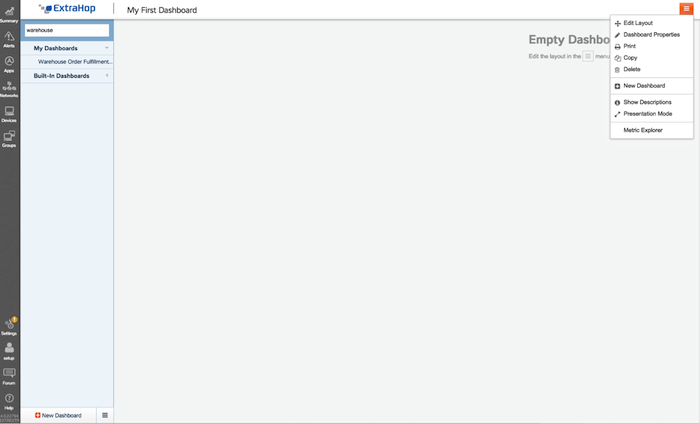
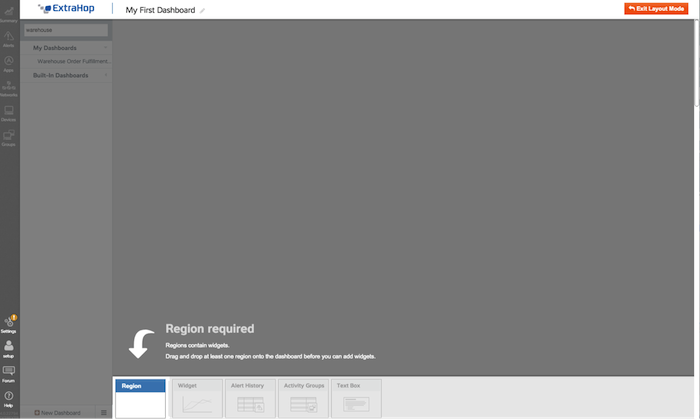
To create a dashboard, click on the "New Dashboard" link the Summary screen of the ExtraHop UI. This will enter you into the layout mode. Remember that ExtraHop Dashboards are a feature in version 4.0 or higher.The dashboard creation flow is to first create a region, then to populate that region with an object, and finally to configure that object.
- Regions can be used to delineate time zones and define visual layout. For example, some regions can be tracking time deltas (this week today versus last week today) while another chart could be looking just at the last 30 minutes, 6 hours, or other time period.
2) After a region is created objects are added to the region. The available objects for a region are: widgets, alert histories, activity groups, and text boxes.
3) Widgets are the primary object type for metrics. Drag a widget into an area to create a chart. The available types of charts are: Area, Bar, Column, Candlestick, Line, Line and Column, List, Single Value, Status.
Look back at the example PII dashboard above. We are using candlestick lines for database transfer sizes because candlestick lines show average values very well—an outlier will be easy to spot. We are using a single value for unauthorized data connections because that value should always be zero; again, it will be easy to spot an outlier if the value is non-zero. We are using text boxes (formatted using the Markdown language) to explain the values and what actions to take for operators and administrators.
Try different metric types and see which ones fit your data best.
Usage and Iteration Phases
To perfect your dashboards, you should try using it in your regular workflow and then iterating through revisions. Dashboards can be copied and modified as many times as needed, making it easy to refine them. With the push of a button, they can be shared between team members who can then make their own modifications. The best way to get a functional dashboard is to use it and refine it to make it serve your needs.In future blog posts, we will deep-dive into individual widget types and explore when and were each may be best.
For now, watch this video to learn how to create a new ExtraHop dashboard from scratch:
Check out this video for a walk-through of dashboard creation in ExtraHop's UI.