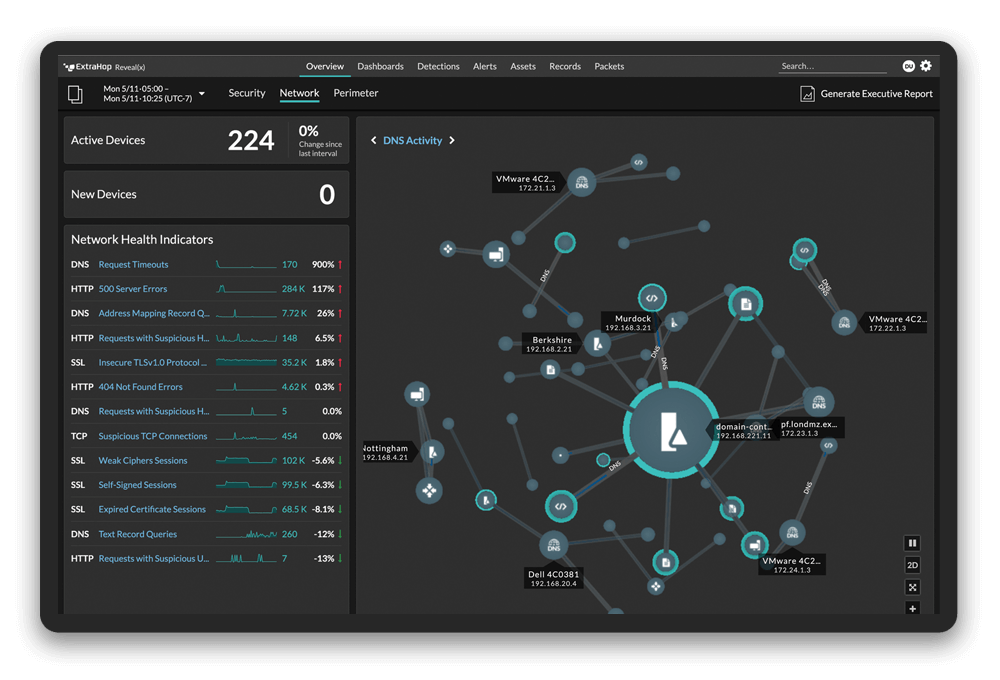
A diagram of the OSI Model.
In Part 1 of this two-part series, we imagined the perfect framework for no-impact monitoring of an application stack and found it was right in front of us all along in the Transmission Control Protocol (TCP). Today, we delve into the particulars of TCP measurement, particularly five TCP metrics featured in the analysis of the ExtraHop system: Retransmissions, Retransmission Timeouts (RTOs), Round-Trip Time (RTT), Aborts, Throttling, and Zero Windows.
First, a quick refresher on TCP: TCP occupies the transport layer of the OSI model (also known as Layer 4), sandwiched neatly between the network layer and the higher-order application protocols. It guarantees delivery of packets across the network, automatically adjusts to changing network conditions, and signals resource contention in host servers.
Although TCP seems like a straightforward protocol, beneath the surface lies a wealth of technical trickery. To immerse yourself in TCP we recommend Wikipedia of course, along with the following texts:
For an introduction to networking as it relates to higher application protocols, consider this text:A Wealth of Network and Application Performance Data
As you discover the mechanisms that drive TCP, consider the wealth of information TCP is putting on the wire. For example, as TCP compensates for inefficient networks and underpowered servers, that compensation is reflected in the TCP connection state. If we can analyze and visualize TCP metrics, then clear pictures of application health emerge.First of all, TCP tells us about the health of the underlying network. We observe retransmitted packets (or segments, in TCP-speak) and infer that they were retransmitted because something failed to deliver them the first time. Retransmissions are considered normal in that TCP recovers from a dropped segment and resumes the connection seamlessly. However, retransmissions are only normal until they're not. Each retransmission results in latency, and as retransmissions stack up, that latency gets worse.
The worst-case scenario is a Retransmission Timeout (or RTO). An RTO occurs when a segment is retransmitted, but the receiver does not acknowledge the retransmission. The sender waits for some predetermined amount of time before retransmitting again. Depending on the timeout value configured in the operating system, this delay can be anywhere from 1 to 8 seconds, which is an eternity in webpage time.
Measuring RTOs enables us to pinpoint congested switches and routers in an internal network, or even across the Internet. Similarly, Round-Trip Time (or RTT) is a measure of total network latency. Although every TCP stack maintains an internal estimate of RTT, the ExtraHop system can measure RTT by inspecting traffic flowing over the wire as well. One ExtraHop customer uses comparative RTT measurements to detect subtle network architecture problems: a problem with the Spanning-Tree Protocol, for example, caused half their traffic to dogleg through a single, under-provisioned switch, introducing an additional 120ms of latency along the way. The problem went undetected for months until they began measuring RTT across hosts!
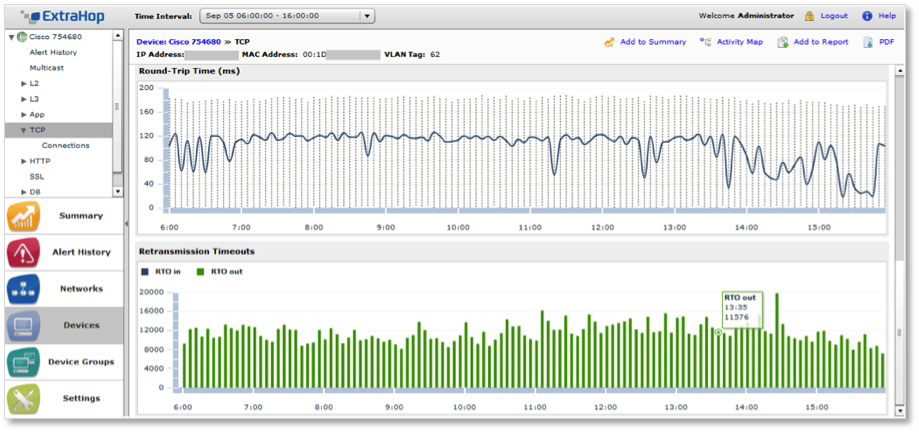
Retransmission timeout and round-trip time metrics can reveal subtle network performance issues.
Monitoring Internal Server Performance with TCP Metrics
What about the host side? Many people intuitively understand that TCP can tell us about the network because it feels like a network protocol. With the right tools, however, TCP can showcase problems internal to the server itself. This visibility is chiefly accomplished with a set of related metrics: Aborts, Throttling, and Zero Windows.A TCP connection is aborted when it is neither explicitly closed nor implicitly timed out: it is simply abandoned midstream. Since an Abort occurs at Layer 4, comfortably removed from the underlying network, it cannot be the result of faulty network hardware. Rather, an Abort is a direct message from application code: "I give up." Abort counts usually correlate with either application errors or intermediary proxies meddling in the end-to-end connection. The ExtraHop system also analyzes other Application-layer protocols so you can see the related HTTP status codes, storage errors, and SQL errors.
Throttling is a side effect of flow control in TCP. (For an overview of TCP flow control, see this relevant Wikipedia article.) Essentially, TCP provides a signaling mechanism by which the receiver can indicate its readiness for more data. If the receiver is busy processing the data it has already received—if a buffer is full, for example, or a database is writing to disk—it will signal the sender to slow the data transfer, giving the receiver time to catch up. Very considerate!
Although Throttling, like Retransmission, is normal, excessive throttling indicates that something is amiss on the receiver side. It could be starved for computing resources or it might be dependent on a third service that is bottlenecking the chain. In the latter case, we can inspect that third dependency to diagnose the root cause of the slowdown.
 Zero Windows are the extreme case of TCP Throttling. A Zero Window message signals that the receiver is completely overwhelmed and the sender should send no data until further notice. Application delivery grinds to a complete standstill. The receiver may eventually recover or, in the worst case, the connection will be aborted and the transaction will fail completely.
Zero Windows have myriad causes, but they are all internal to the receiving host—they are not the result of bad networks. We recently helped a customer who fingered Zero Windows as related to the cause of a revenue-impacting outage: when Zero Windows went up, their website went down. Zero Windows are never the source of a problem in and of themselves. Like the rest of our TCP metrics, they are TCP's response to host-level problems. In this customer's case, we helped them trace the Zero Windows back to an application architecture that guaranteed database deadlocks. Even better, their database profiling software failed to catch the deadlocks. TCP analysis to the rescue!
Pairing TCP Analysis with Application Protocol Analysis
Which brings us to the real power in studying TCP: marrying these Transport layer findings with measurements of the higher-order application protocols. By tying TCP measurements to Application layer metrics such as transaction speed, per-user statistics, and dependency mapping, we arrive at full visibility of our applications. Again, the ExtraHop system gathers all this information passively with zero overhead introduced to systems or networks. Perhaps we will cover these Application layer metrics in a future post. If you have ideas for that post or questions, please use the comments section below. For now, the path to enlightenment is simple: Use ExtraHop!Want to learn more about protocols that ExtraHop can monitor and decode, including DNS, SIP, HTTP, FTP, memcache, and any TCP or UDP-based protocol? Check out our Protocol Support Page