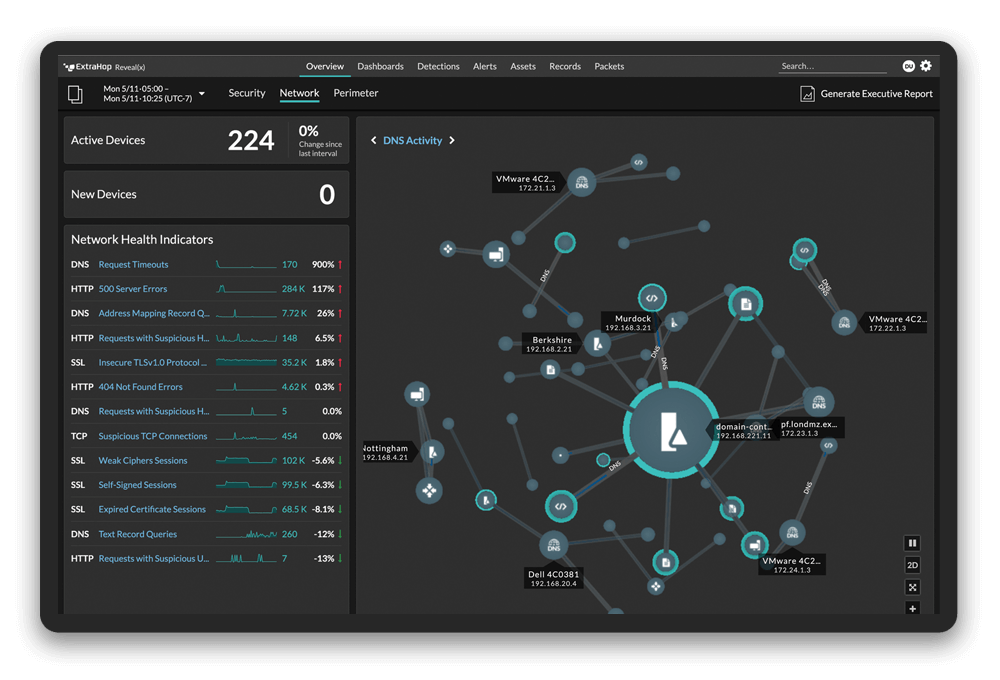
As you troubleshoot a complex issue such as slow application performance, the true culprit might be out-of-sight and out-of-mind. For example, errors returned from DNS and database servers can have detrimental effects on their dependent applications. But these errors can be hidden from traditional network monitoring tools. Why? Because tools that rely on flow summaries or packet headers can't always detect and analyze categories of DNS or database errors, making it difficult to pinpoint what caused the error.
The ExtraHop platform, which monitors wire data in real-time, provides several troubleshooting tools to pinpoint network and application problems. Among these tools is the Metric Explorer, which lets you construct dynamic views of device and network behavior through a variety of charts.
In this blog post, I'll highlight the versatility of Metric Explorer and show you how to uncover examples of hidden infrastructure issues.
Begin your troubleshooting expedition
Without the ExtraHop platform, you might spend hours checking server logs, machine-generated data, and packet captures to search for the culprit behind a slow application. With the ExtraHop platform, charting data in the Metric Explorer can get you closer to identifying the underlying cause with a small number of clicks.
Launch the Metric Explorer from either a protocol page or a dashboard.
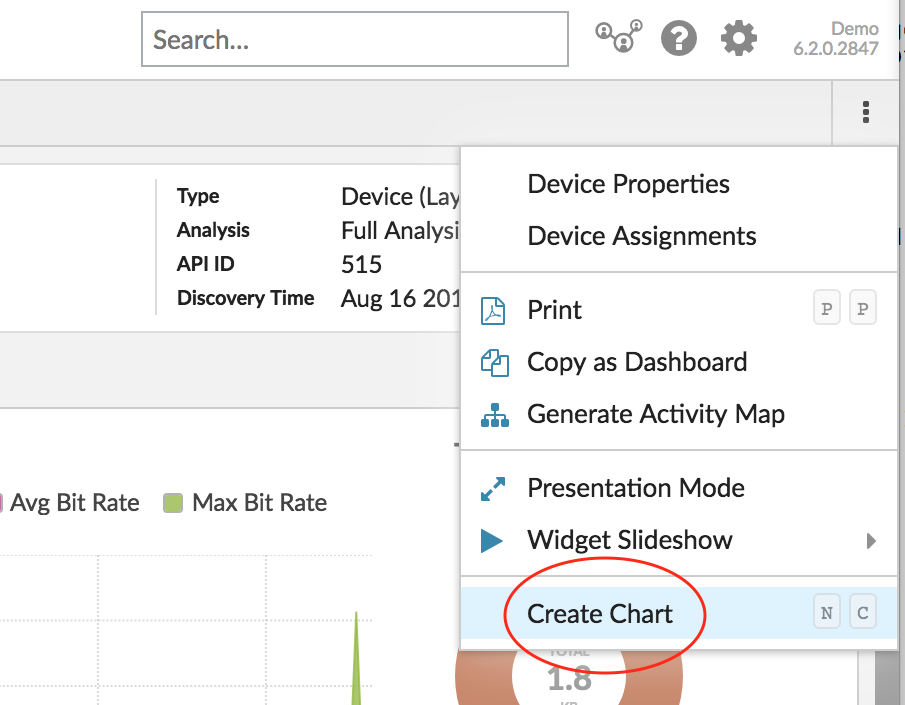
From the ExtraHop Discover or Command appliance, click the menu in the upper right corner of the page and then click Create Chart to launch the Metric Explorer.
Select a source for your metric data, such as the All Activity application, which is available to all ExtraHop users. All Activity is a container that includes all the metrics associated with every active device and protocol discovered on your network by the ExtraHop platform.
First, let's look at the Database Error metric and select the Value chart to see the total count of errors or the average rate of errors over time. Adjust the time interval to when the slow application was reported. If the number is zero, you've ruled out database errors.
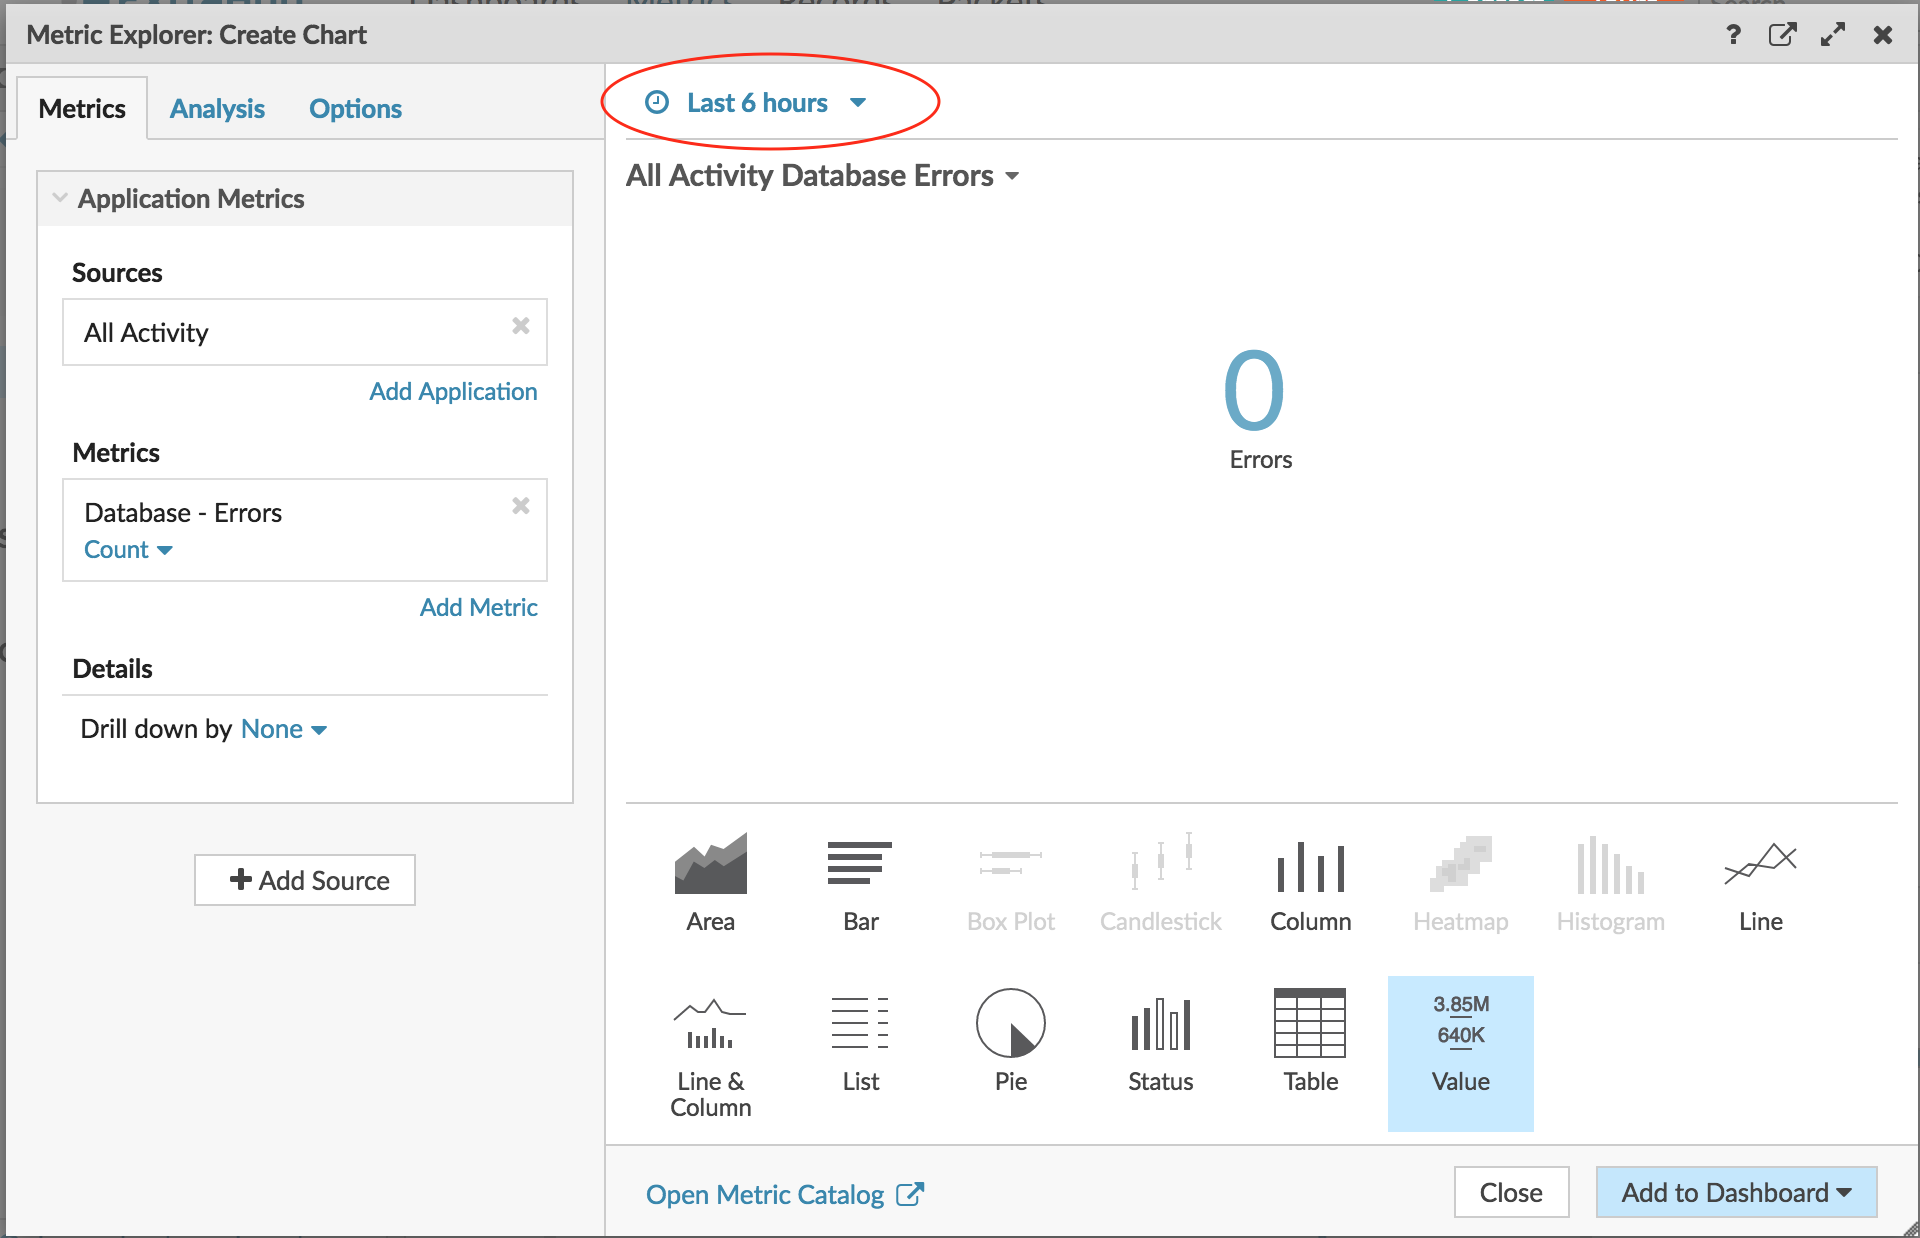
In the left pane of the Metric Explorer, make data selections by clicking the Sources and Metrics fields. At the top of the page, adjust the time interval.
Next, replace database errors with DNS errors. Then change the Value chart to the Line chart. A spike here indicates that a DNS server misconfiguration could be contributing to application delays of 2-4 seconds.
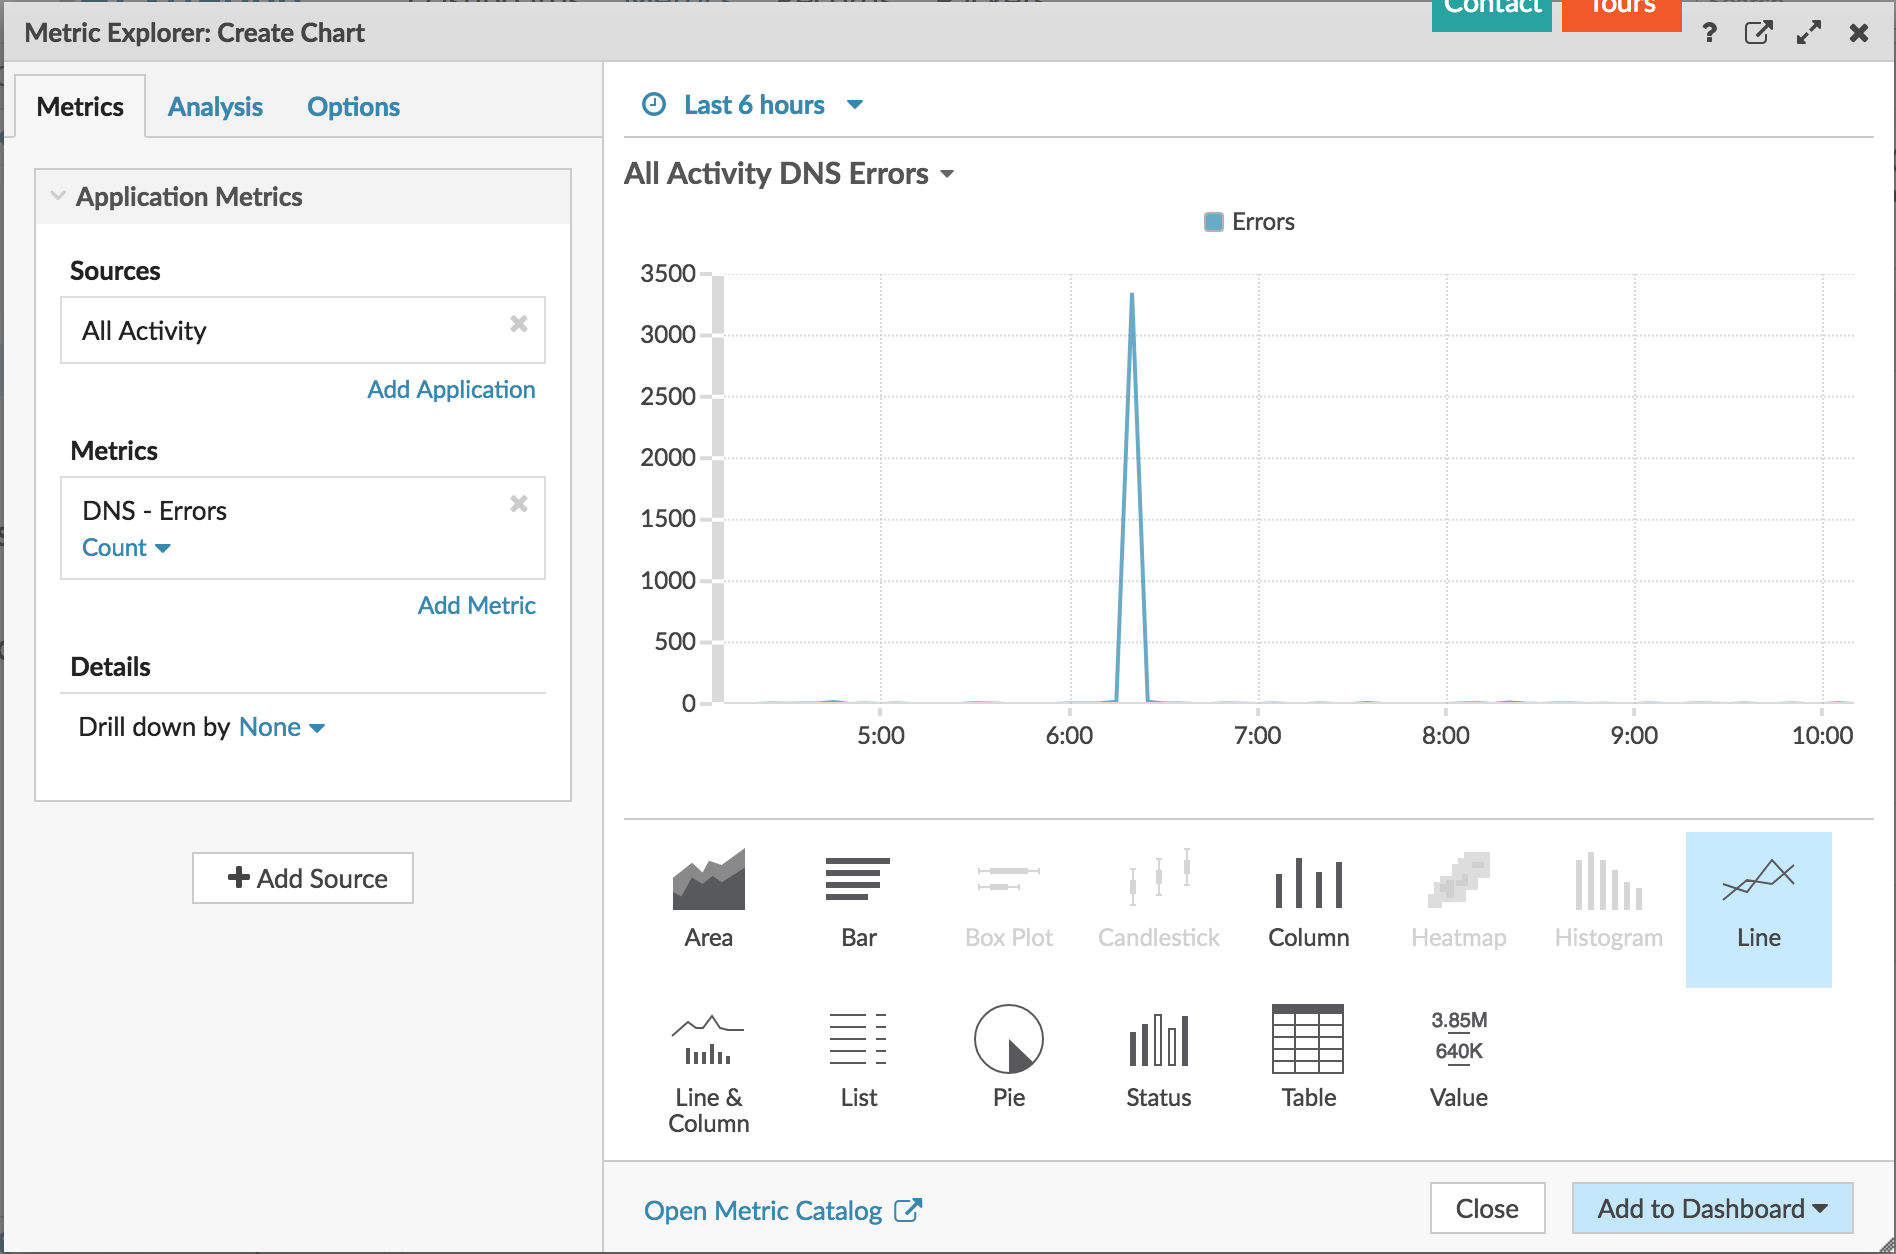
To find out which hostnames could not be resolved by DNS servers during this time, drill down into the DNS errors metric by host query. From the bottom of the page, change the Line chart to the Table chart.
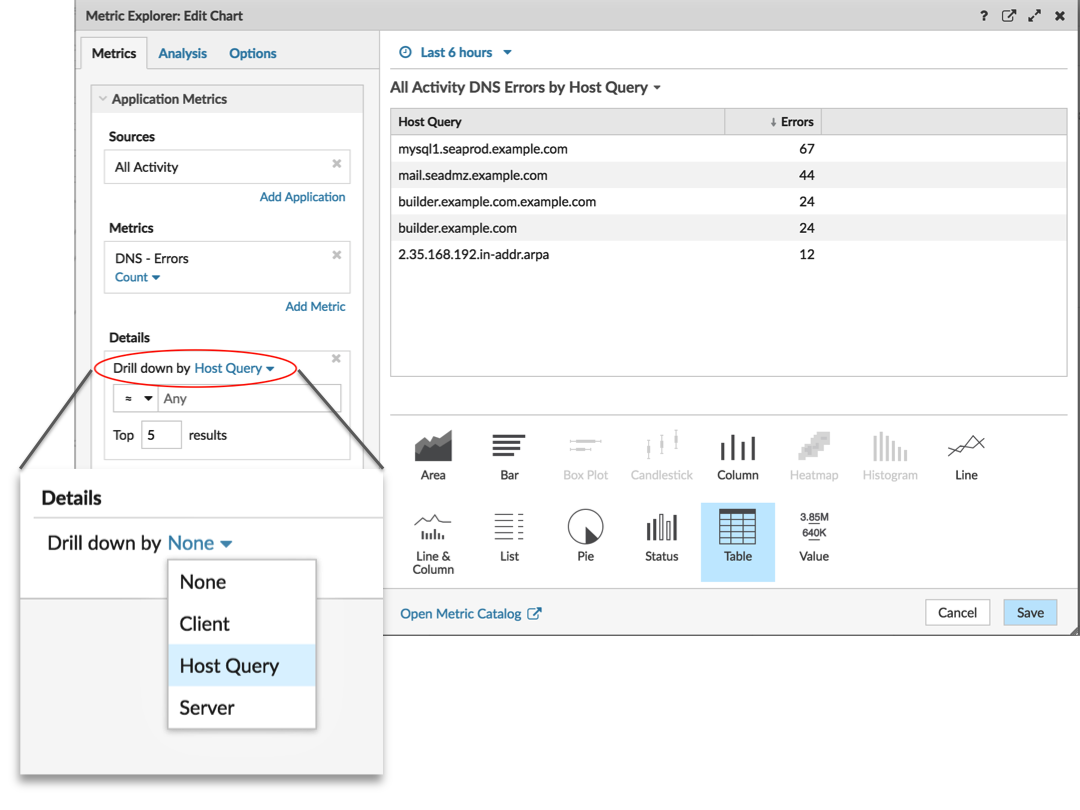
Is the slow application making one of these bad host queries? If so, DNS issues could be delaying the application's ability to communicate with other systems. If you want to confirm which clients are responsible for making invalid hostname queries, replace your drill-down selection with clients.
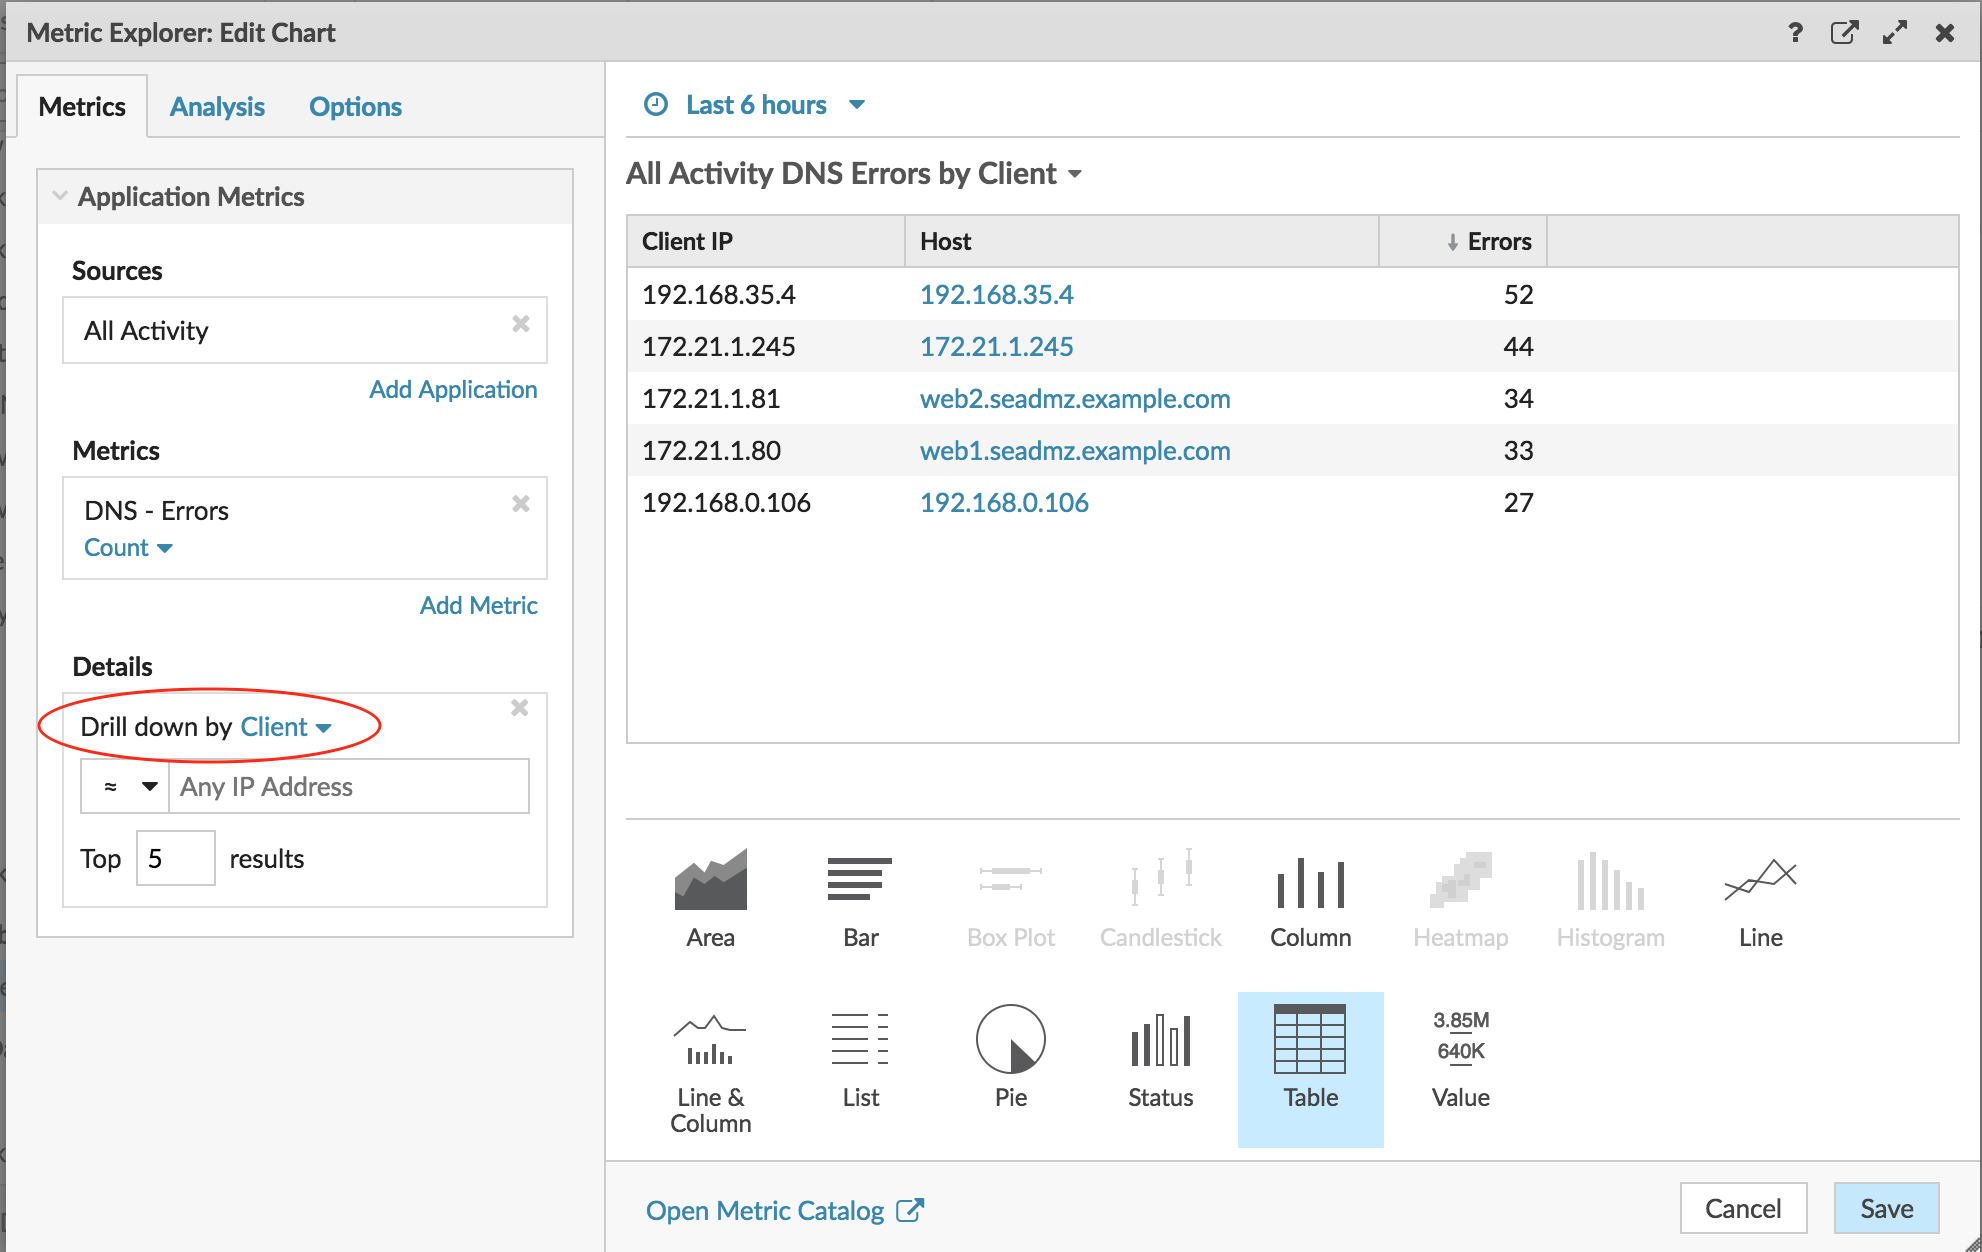
Voila! Within a single tool, we've explored different metrics within different charts, and found specific details about what's going wrong.
Practice makes perfect
The Metric Explorer might be a little intimidating because of all the available options you can choose from. But don't worry! We have new dashboard walkthroughs to help you practice building charts with the Metric Explorer. As your reward, you'll create usable dashboards that will help you keep a watchful eye on DNS and dashboard errors.
