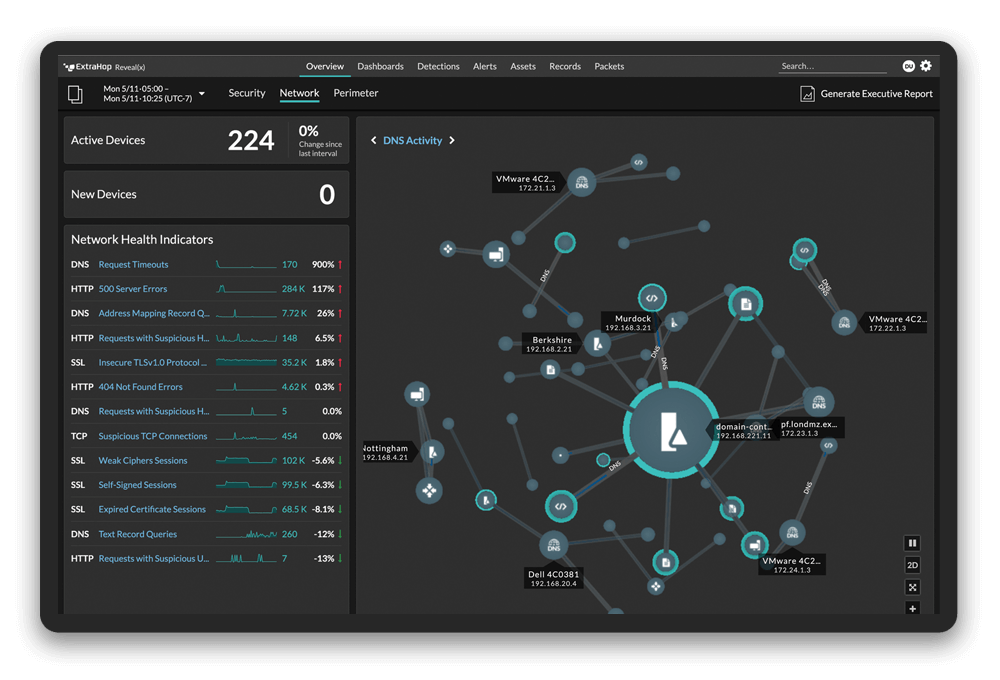
A number of organizations use ExtraHop and Splunk together, enriching their log data with real-time metrics and events from the network. This week, ExtraHop released an updated integration that makes it easier to correlate ExtraHop wire data with other data Splunk manages and indexes.
The new integration does not require an ExtraHop bundle. Instead, it uses an add-on and app on the Splunk side that pulls data from ExtraHop's REST API, making all of the metrics from the streaming datastore on the ExtraHop product itself available. This means that you can pull in any of the 4,000+ built-in real-time metrics from ExtraHop into Splunk, in addition to any custom metrics that you define.
There are two main components that you need to install:
- The ExtraHop Add-On for Splunk - Installed on the heavy forwarder or search head, this add-on defines a Splunk modular input that uses the ExtraHop REST API to import 30-second wire data metrics into Splunk. Users can configure these data inputs to import any built-in or custom metric for any application, device group, or activity group on an ExtraHop appliance.
- The ExtraHop App for Splunk - This app adds contextual information to the data that the ExtraHop Add-On collects to make searching in Splunk easier. The ExtraHop App also provides three example dashboards (for DNS, Storage, and HTTP) and pre-configured inputs to help you get started.
The app also automatically generates contextual back-links for devices and activity groups in ExtraHop. This means you can easily navigate from Splunk back to ExtraHop to perform deeper investigation using live activity maps and ExtraHop's powerful record search. And if you need to, you can download packets that make up the suspect transactions.
Why ExtraHop Metrics in Splunk?
ExtraHop can immediately record metrics and events to Splunk that cannot be logged otherwise, including:
- DNS and other metrics that offer broad coverage without having to ingest high volumes of logs
- Consistently formatted logs across heterogeneous data center components, such as network storage systems from different vendors
- High-priority events and anomalies
- Specific correlated network, web, VDI, database, or storage events, such as when database transactions exceed a set amount from one or more specified clients
By ingesting ExtraHop data into Splunk, you can fill in visibility gaps as well as increase your signal-to-noise ratio with observed and deterministic wire data. Once in Splunk, this data can be correlated with logs from your environment and of course used to drive automated workflows.
Related materials:
The ExtraHop REST API: An Elegant Weapon for a More Civilized Age
Older versions of our integration relied on an ExtraHop bundle that included triggers and syslog messages sent to Splunk. For this version, we chose to leverage the ExtraHop REST API—a more elegant weapon, to borrow Obi-Wan's words—in this integration for a few reasons:
- Using the REST API is more performative and scalable than sending syslog messages to Splunk through triggers. The ExtraHop trigger engine is a powerful and popular feature, but we decided it was better to save precious computational resources for extracting value from wire data rather than deluging Splunk with copies of everything ExtraHop sees at the moment we see it.
- Exporting to syslog via trigger is not as reliable as pulling saved metrics from the REST API. If a network interruption drops a UDP syslog message from ExtraHop, you'll never see it in Splunk—those packets disappear into the void. The ExtraHop Add-On for Splunk, however, tracks the last time it received data so it can catch up if it misses a few data points due to a maintenance window or a misconfigured router.
- Another consideration in using the REST API was to reduce the volume of data sent to Splunk. Condensing a wealth of wire data into 30-second metrics helps you to get the most out of your Splunk license.
What's Next
We're very interested in hearing what you think about our new Splunk integration. Do you have ideas for improvements or additional features? Ideas for how you're using Splunk and ExtraHop together? Let us know in the forums.
You can find the ExtraHop Add-On for Splunk and the ExtraHop App for Splunk as free downloads in SplunkBase.
